Adam Taggart / Michael Howell Interview Notes 12/24/23
12/29/2023
2:00 - Is liquidity shrinking or increasing? Assessment of the global economy.
MH: We are in a financial markets upcycle. Strong tailwinds. Everyone waiting for a "Lehman moment" - thinks that was a one-off unlikely to happen again.
The base school of thought is that the financial markets are there to help businesses raise capital, but that's not the case nowadays because not a lot of capex is going on. The big driver of the financial markets right now is the refinancing of debt. $70T of debt gets rolled every year. To roll that debt you need "balance sheet capacity", aka "liquidity" (or their definition of liquidity).
Interest rates are meaningful for new capex, but in a refinancing kind of economy liquidity is more of a factor. Central banks' job is to provide more liquidity when needed.
Doesn't make sense to use macro to predict asset prices. Assets drive the economy and macro indicators.
10:00 Balance sheet capacity - he's referring to the balance sheet of the financial sector. The credit providers.
The liquidity generating parts of the Fed balance sheet are important, and the extent to how that liquidity can be leveraged in the system. Collateral as the backing for loans.
If you drill down into asset price performance, like the S&P being up and being led by technology stocks, all those features are part of the early liquidity cycle. Markets are screaming that we are in a liquidity cycle that is turning up. Nothing unusual about it at all.
13:00 Interest rates don't matter as much now?
MH: Interest rates are much diminished in their important. Example: you have a mortgage that you want to roll over. The importance is being able to roll over the debt for refinancing, and not so much than the interest rate itself. Greenspud: I think he's suggesting that there's an inelastic demand for the debt - interest rate can go up and it doesn't matter so much because 5% or 2%, people are still willing to pay it as long as they can roll it over. I think this has some truth but I wouldn't discount its impact completely. Even here he said that it's different if the interest rate was a jump to something farther like 20%.
Pension funds. In the UK pension funds are more mature than in the US. 10 years ago more than 50% of pension fund assets were in stocks, the rest in fixed income. Today it's 14% in stocks and most everything else is fixed income. The ability to do arbitrage between stocks and bonds is diminished.
The US - 401k plans. 85% of 401k plans are now "target life funds", not doing an asset allocation. No arbitrage between stocks and bonds. What works then is the inflation rate. Use the inflation rate as the discount factor (i.e. the rate you use when building a DCF model) and the stock market is very closely related inversely to inflation. Greenspud: He's basically saying the way most people build discounted cash flow models is "wrong". This is some very unconventional thinking, a bit of financial modeling "magic" going on here. It kind of makes sense to me, but only if you assume the real risk free rate is 0% and inflation is all that matters.
This year (2023), 3 things were going on: bond yields going up, global liquidity rising, and inflation was going down. The latter two were the driving factors of the market - liquidity and decreasing inflation were good for stocks.
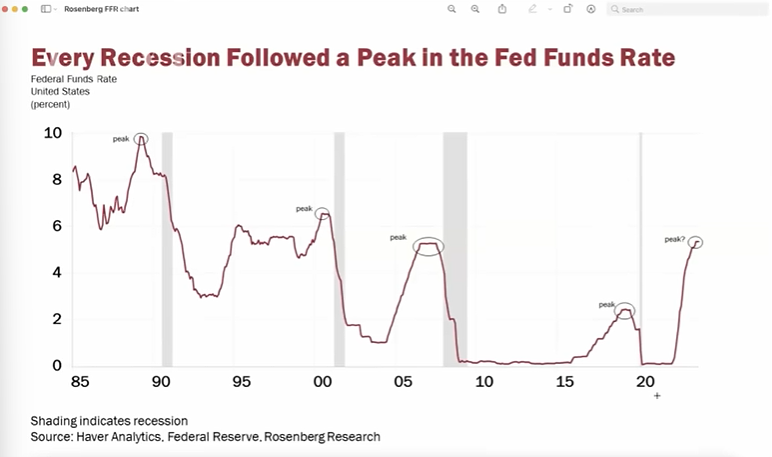
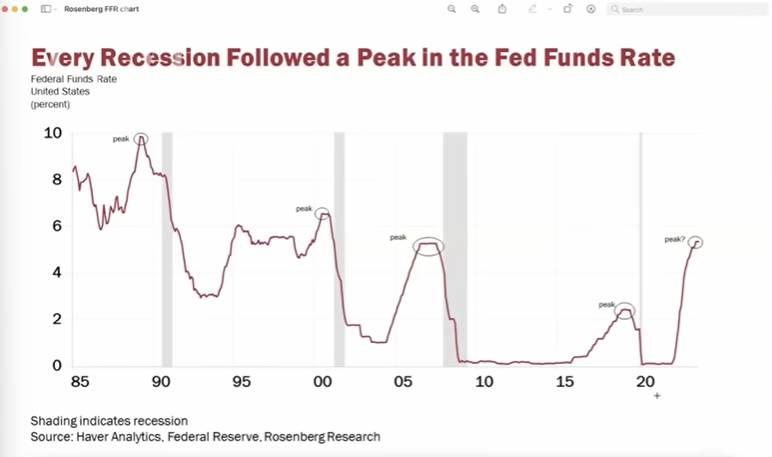
18:30 Fed funds rate vs recessions. All recessions for past 30 years have been preceded by a sharp rise in interest rates. Are things "different this time"?
MH: interest rates are simply one indicator, not necessarily everything that drives recessions. A similar chart could be made showing the correlation between recessions and oil prices.
What we are in now seems more like the 90s where we had "rolling recessions" in various sub sectors of the economy but never the whole economy at the same time.
21:30 - lag effect of the Fed
MH: not really expecting a significant impact. There is some economic cycle slowing, but no great evidence of a big recession. Cites LA port authority seeing an increase in volume.
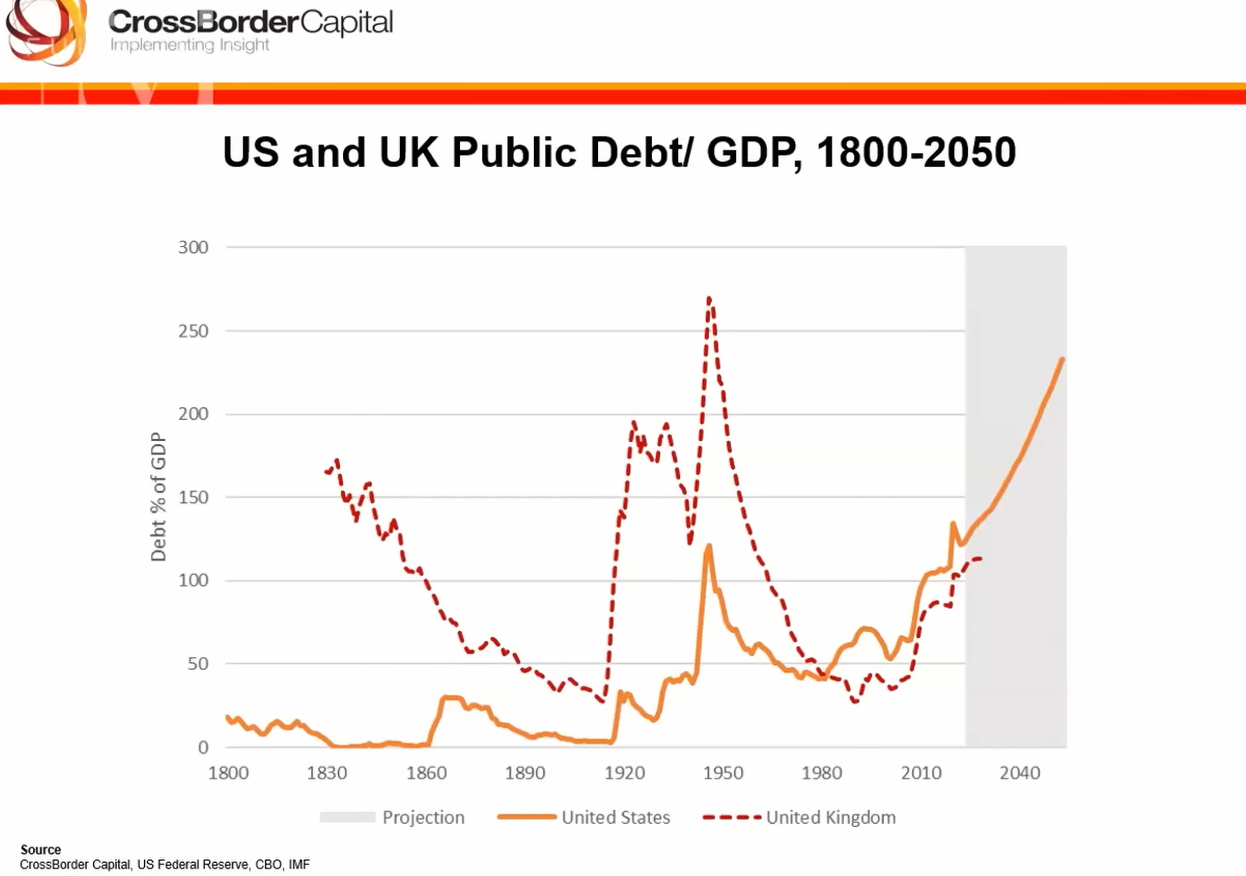
25:00 CBO and IMF debt to GDP ratios, long term trend.
Anticipated to reach 250% debt-to-GDP by 2050. Last economy that got to that level was Britain post-war. Was not good for the economy. That level of debt to GDP had a bad effect on the US economy. The longer that you "screw down the banks" with an inverted the yield curve, the more you hurt the future growth prospects.
MH: optimistic about the current liquidity cycle because fiscal policy is lifting the economy upward, but concerned about the long term trend. Government can't do much to fix the long term problems of unhealthy debt levels.
He believes the Fed will try to steepen the yield curve in 2024 using rate cuts.
Something that I can't reconcile about this is that historically when the Fed enters a rate cut cycle, the stock market goes through a severe drawdown. Here's a video where George Gammon talks about this phenomenon.
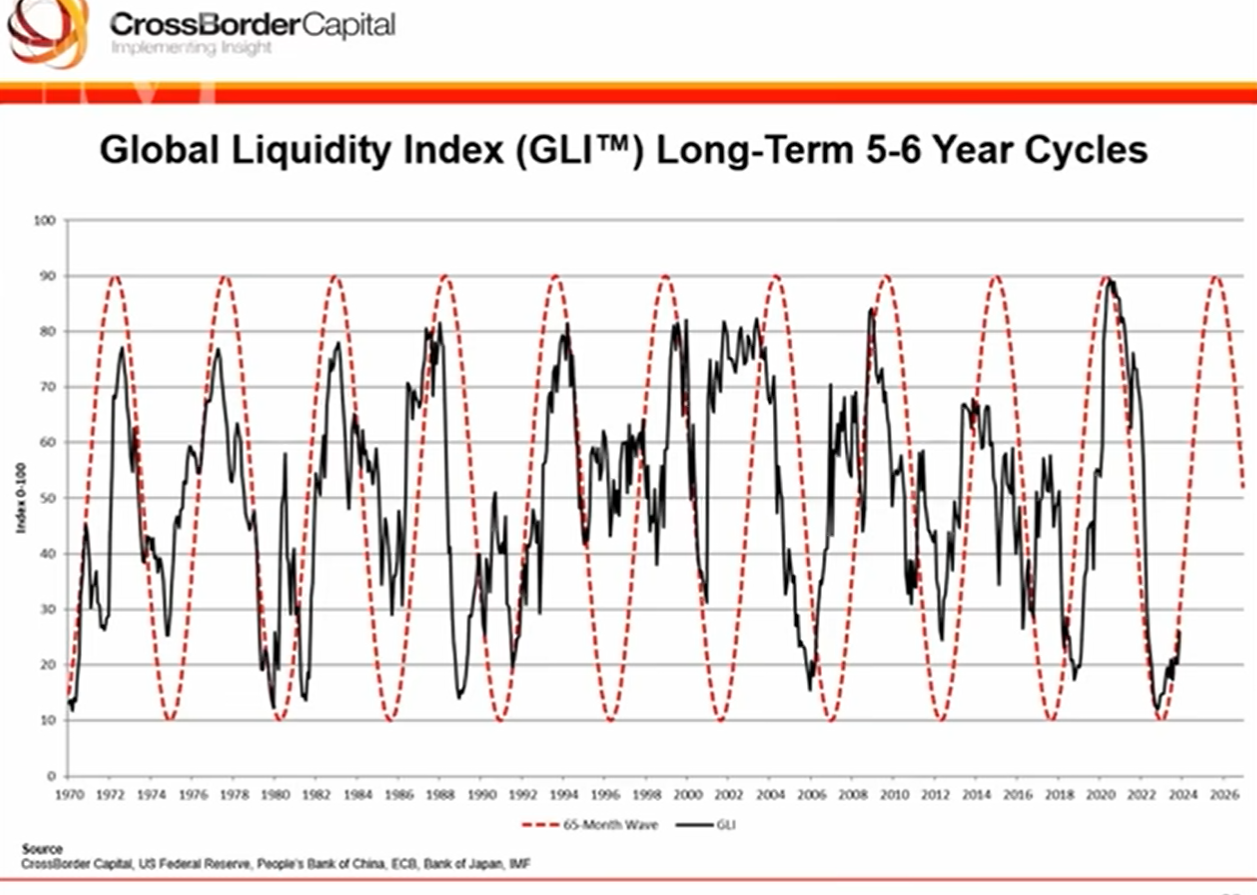
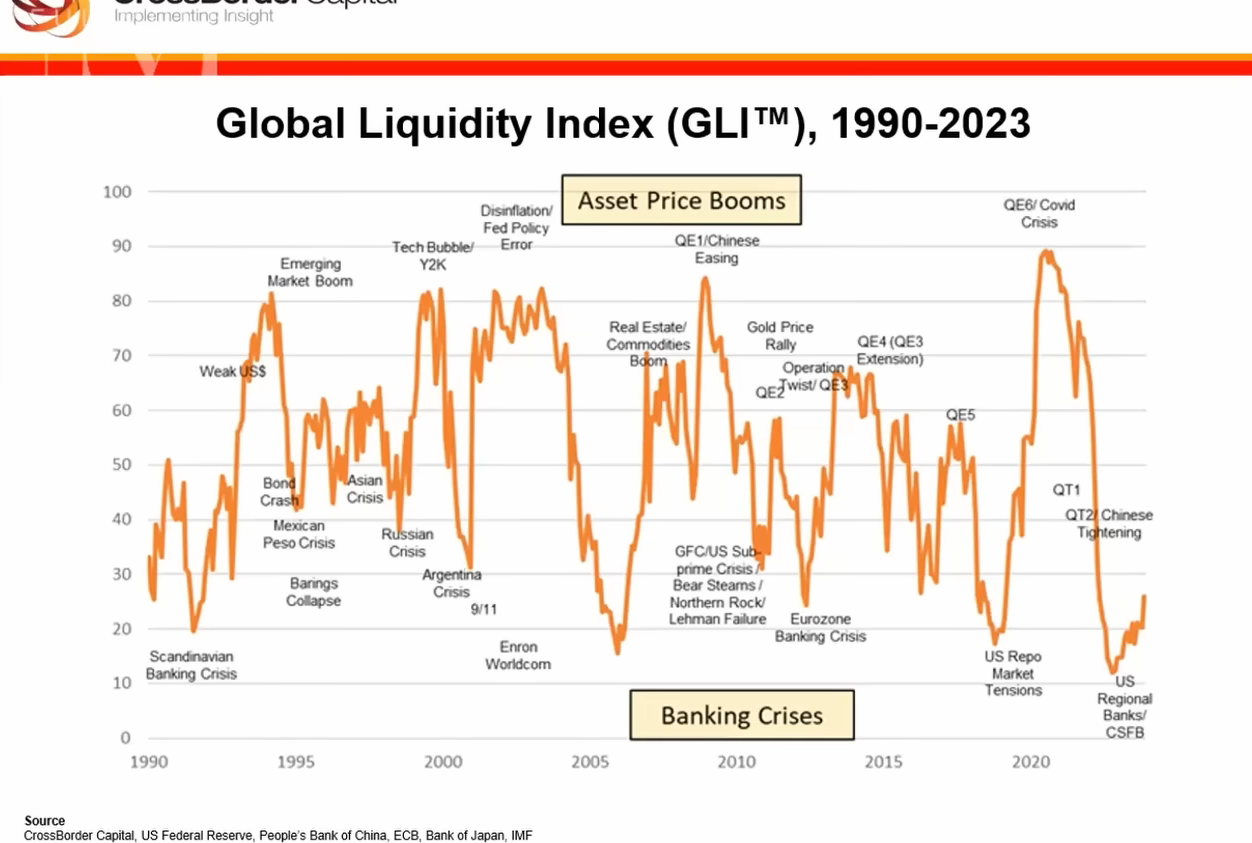
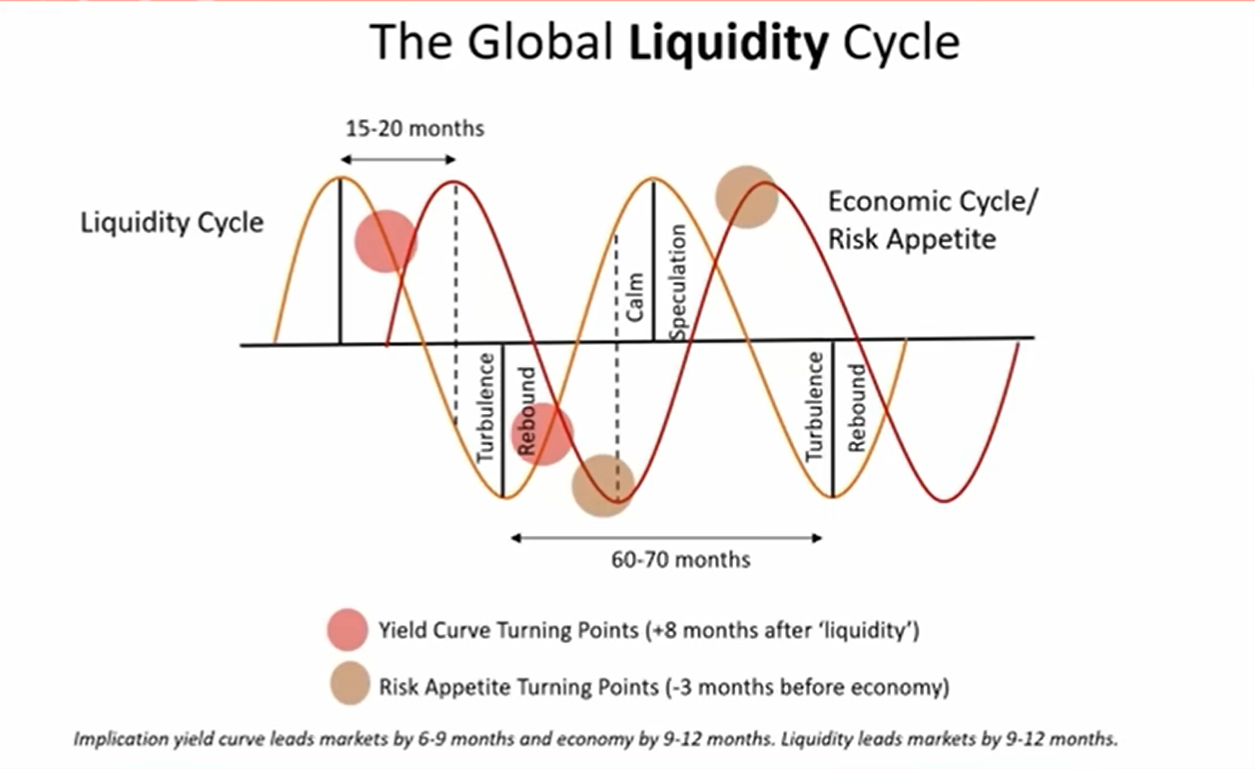
31:00 global liquidity cycle
Black line on chart is flow of money through global financial markets, an index of 0 through 100. (Not M1 or M2 - doesn't find those meaningful in a world of global liquidity and shadow banking. This metric is much broader.) Dotted red line is a sine way overlay.
Average cycle seems to be 65 months and repeats.
Low point was 2018-2019, spiked after 2020 stimulus, and then crashed again with QT. Right now at a low point, with the peak expected ~2025.
Global liquidity is a funding definition based on the assets-side of credit providers' balance sheets. It comprises of 1) Central Bank interventions 2) bank and shadow bank credit, corporate cash flow, collateral-based wholesale and repo market activity 3) net foreign flows.
Money supply only equates with liquidity when there are NO shadow banks AND high street banks obtain all their funding through deposits.
Think of liquidity as wholesale measure that starts here conventional definitions of 'money' (e.g. retail bank deposits), end
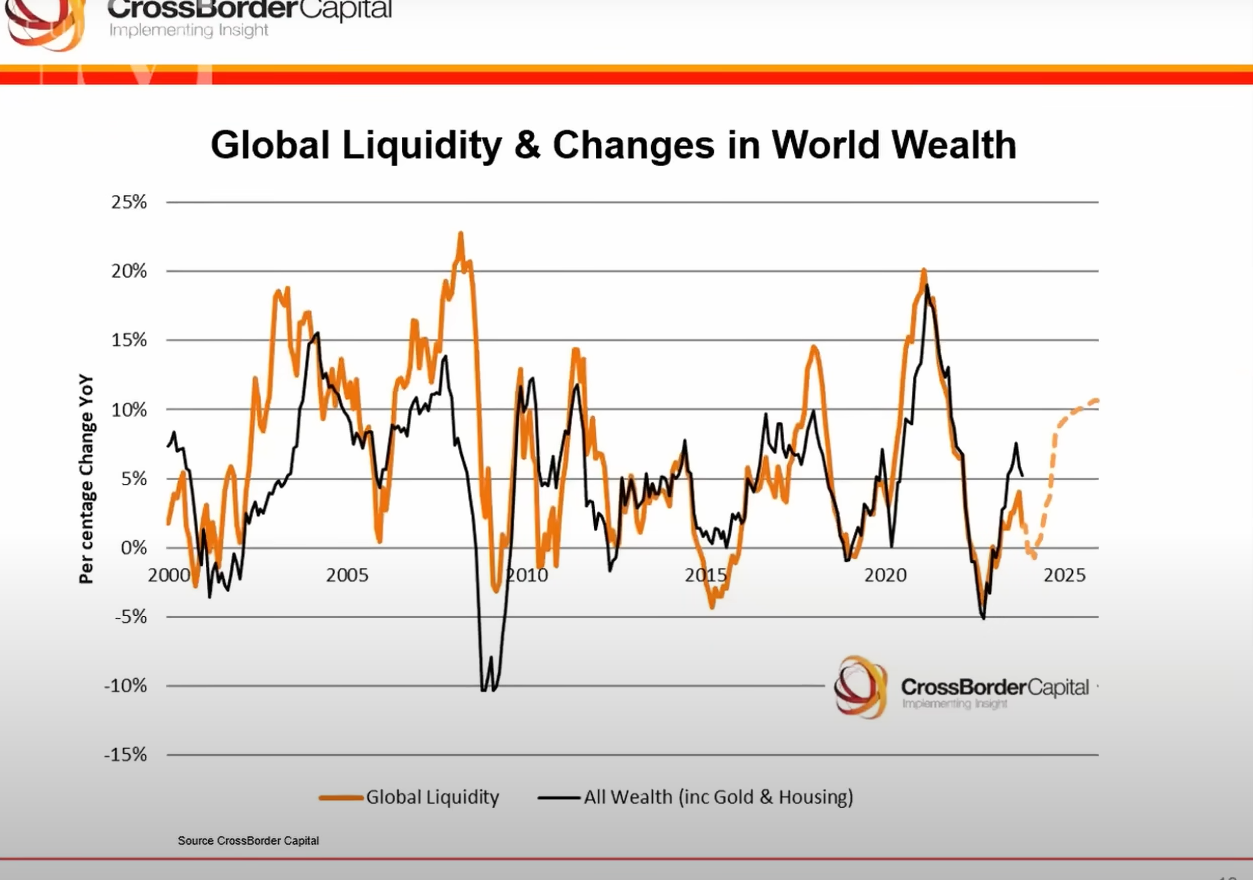
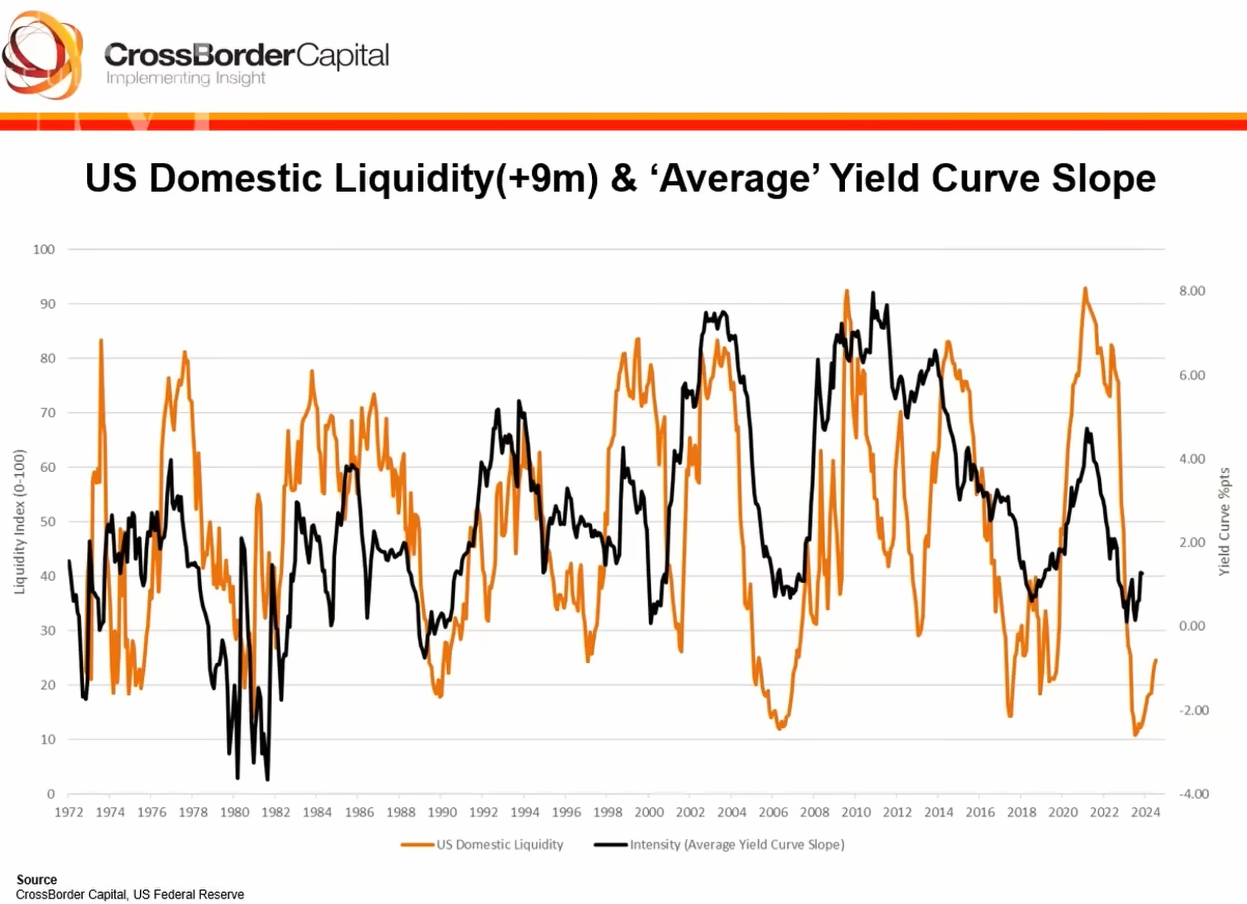
43:00 global liquidity and wealth I think this chart makes sense. If global liquidity correlates with higher asset prices, then if asset prices go up of course wealth increases.
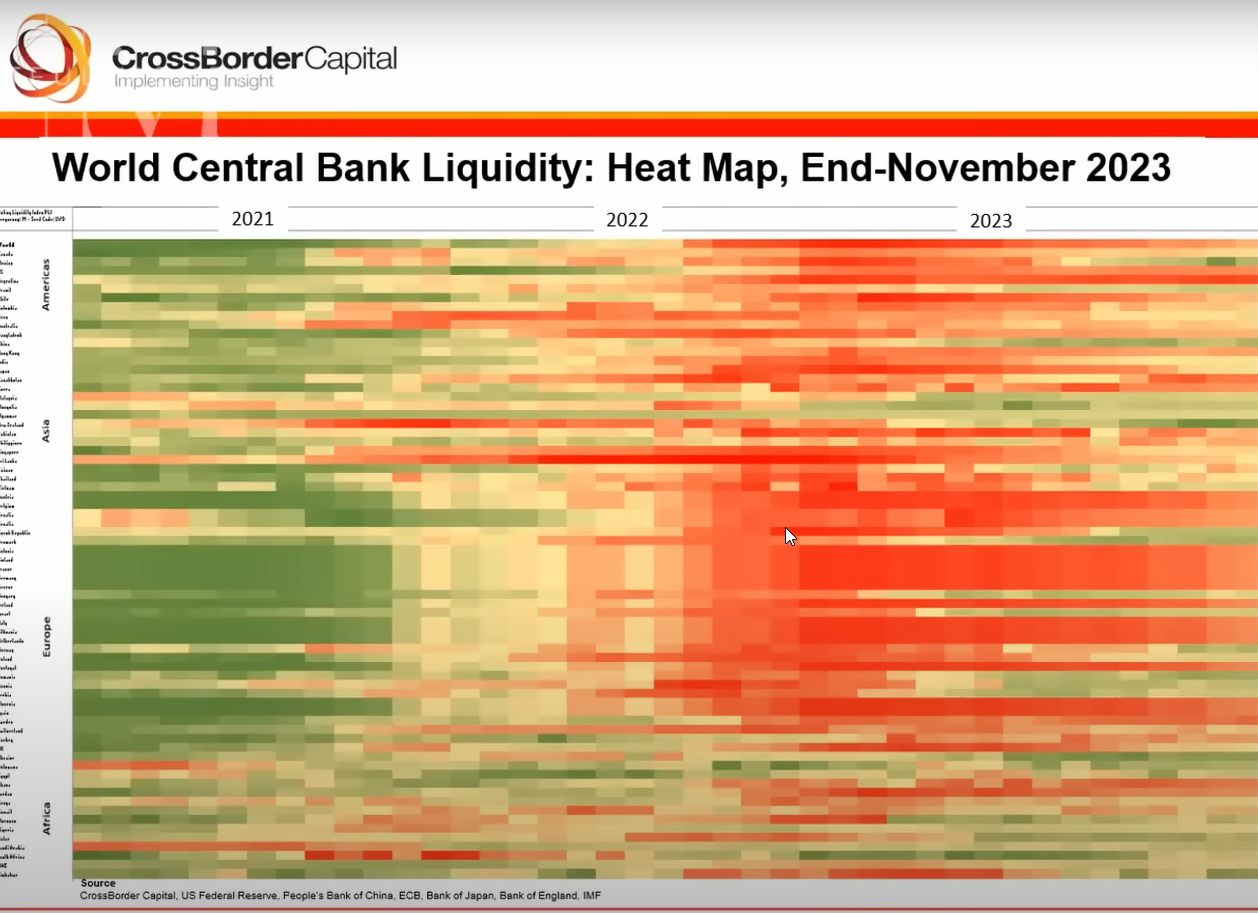
Heatmap of central bank activity. Green is easing, red is tightening. Maximum tightening was in 2022, we are entering an easing cycle.
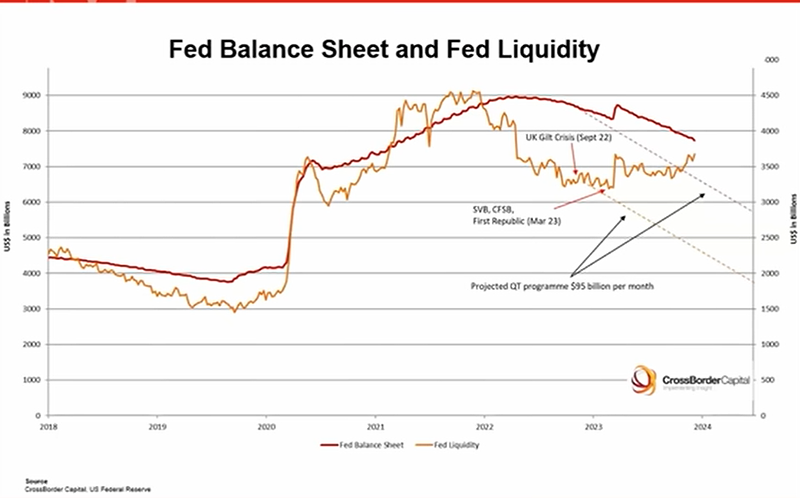
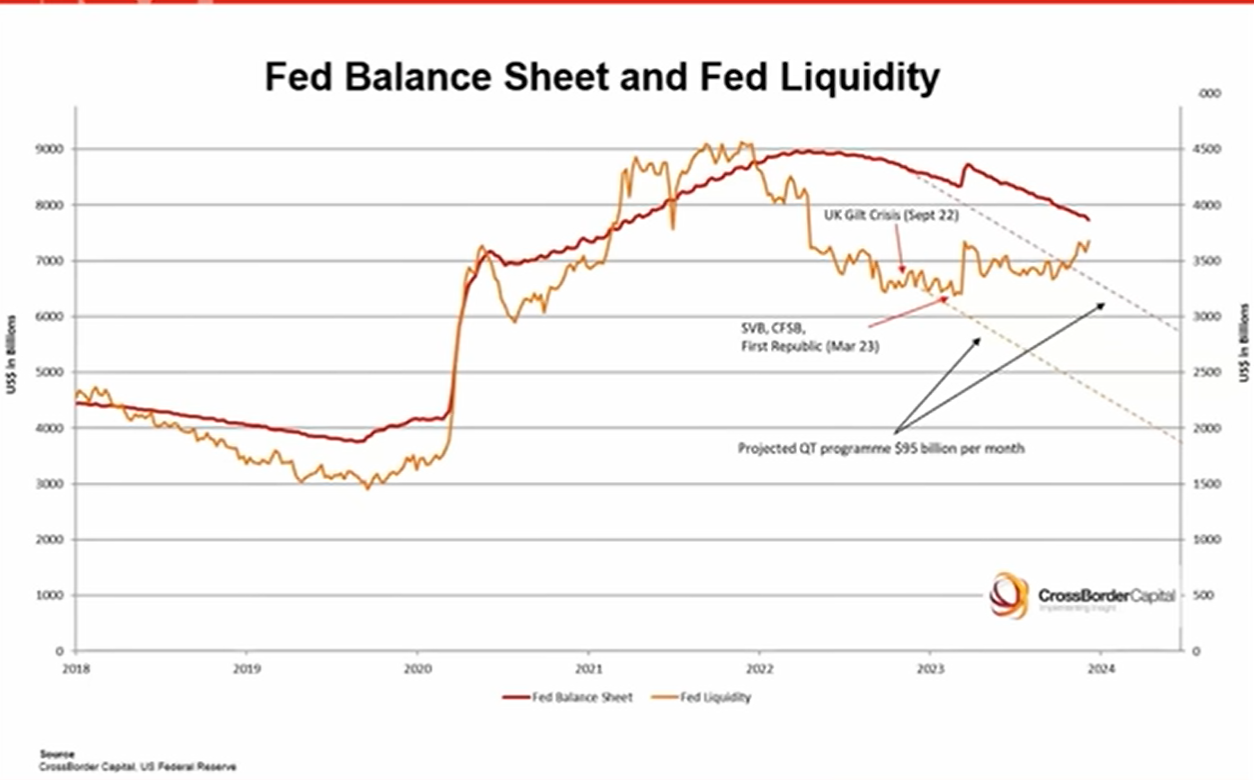
Fed liquidity are injections into the money markets (orange). Red is the Fed balance sheet. Declining now because Fed is allowing Treasuries to expire on the balance sheet. Despite balance sheet shrinking, the liquidity being injected into market is rising.
If we are correct in assessing that rates will be cut next year, it's unlikely QT will continue (which increases liquidity).
"Reverse repo ...is technically a withdrawal of liquidity from the markets, will be run down aggressively as money market funds basically switch from the Fed's overnight account into Treasury bills, which are basically term instruments, and they will pay a more attractive interest rate than overnight. I think that will happen and those are liquidity boosts." Greenspud: this is a stark contrast from what other guests (Danielle DiMartino Booth and Michael Pento) have said, saying that drainage of the reverse repo is decreasing liquidity.
The Federal Reserve oversees the amount of liquidity going into money markets - that's its job. Bank term funding program is important. Rundown of the reverse repo is significant because that's money "siloed" on the Fed balance sheet paying interest to the money market funds when there was an absence of Treasury bills in the system. Now Treasury bills are abundant, causing a significant draw down of the reverse repo account.
Treasury General Account fluctuations. Recovered to about $700B.
Federal Reserve is making losses on its bond portfolio by making less on its holdings than it is paying out. When that occurs it puts liquidity into the system.
Red dots are inflections in yield curves. Financial markets lead the economy, not the other way around.
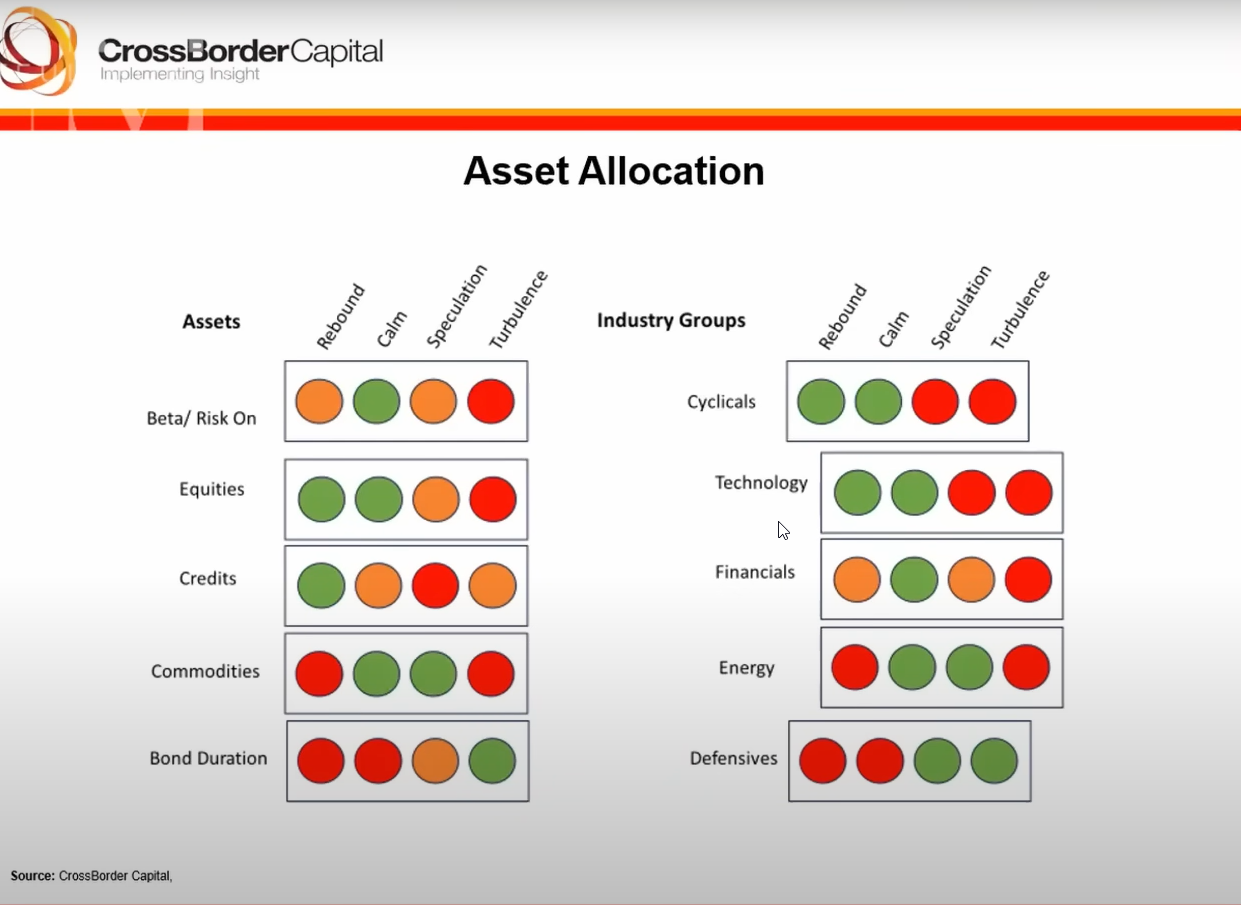
Assets to be in for each step of the cycle. During rebound you want to be in equities and credit. Underweight commodities and bond duration. That's what we've seen in 2023. Also be overweight technology and cyclicals, underweight defensive stocks and energy.
As we transition to the "calm" part of the cycle, you want to be more risk on - keep the tech stocks and cyclicals. Don't take on bond duration. Start building into commodities financials, energy, remain underweight defensives.
Greenspud: this chart mirrors similar guides I've read about how to time investment cycles. If he is correct, then 2024 should continue many of the same trends as 2023. This is good for big tech and the magnificent 7.
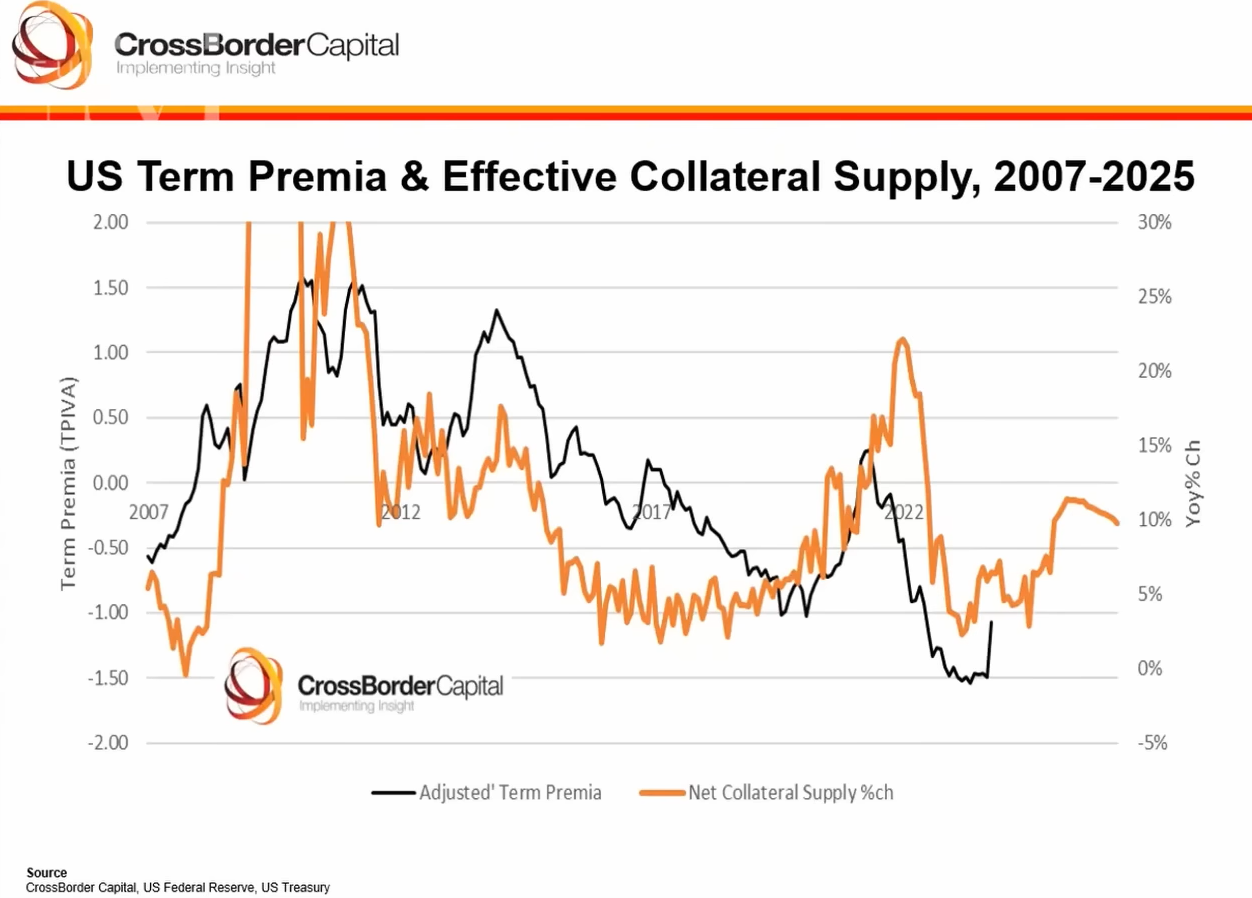
As the liquidity cycle moves along, the yield curve steepens. When that happens, it's unfavorable for the long end of the market.
This is confusing to me. Many folks like George Gammon are pointing out that when the yield curve steepens and/or the Fed starts cutting rates, that's the precipice for a drop in the stock market.
If the black line goes up, that's bad for long duration bond holders.
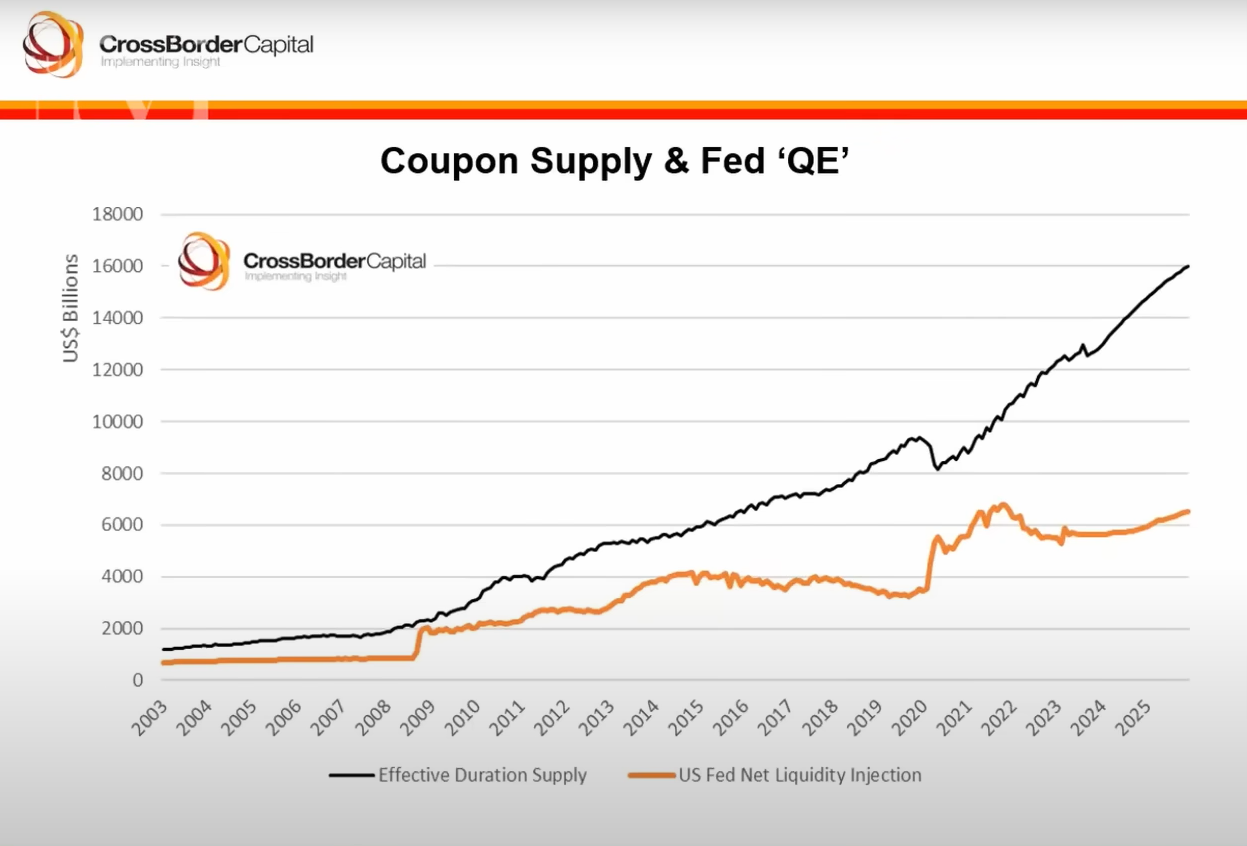
Orange line represents the likely supply of coupon debt in the markets. Treasury bond issuance is going up at a faster pace, which will push interest rates up at the long end of the market.
Black line is supply of coupon yielding securities (i.e. Treasuries). Orange line is the amount of that which the Fed is buying, effectively soaking up. MH thinks the Fed will have to continue buying long duration debt to keep interest rates low.
Comparison of US debt-to-GDP vs Britain in the past. US is on same trajectory. Britain's economy started to underperform in the 60s when debt to GDP got too high.
They believe that defense spending will go up to 5% of GDP and the Fed balance sheet will expand to absorb new debt. This provides liquidity to the markets, but also causes monetary inflation.
MH thinks the US is the "cleanest shirt in the laundry" and USD will outperform other currencies, but may not outperform "dedicated monetary hedges". Long term outlook looks worrying.
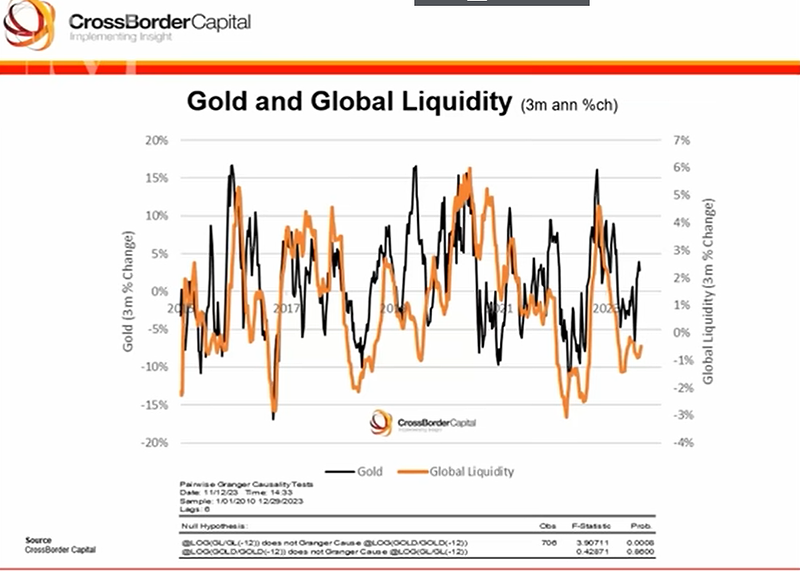
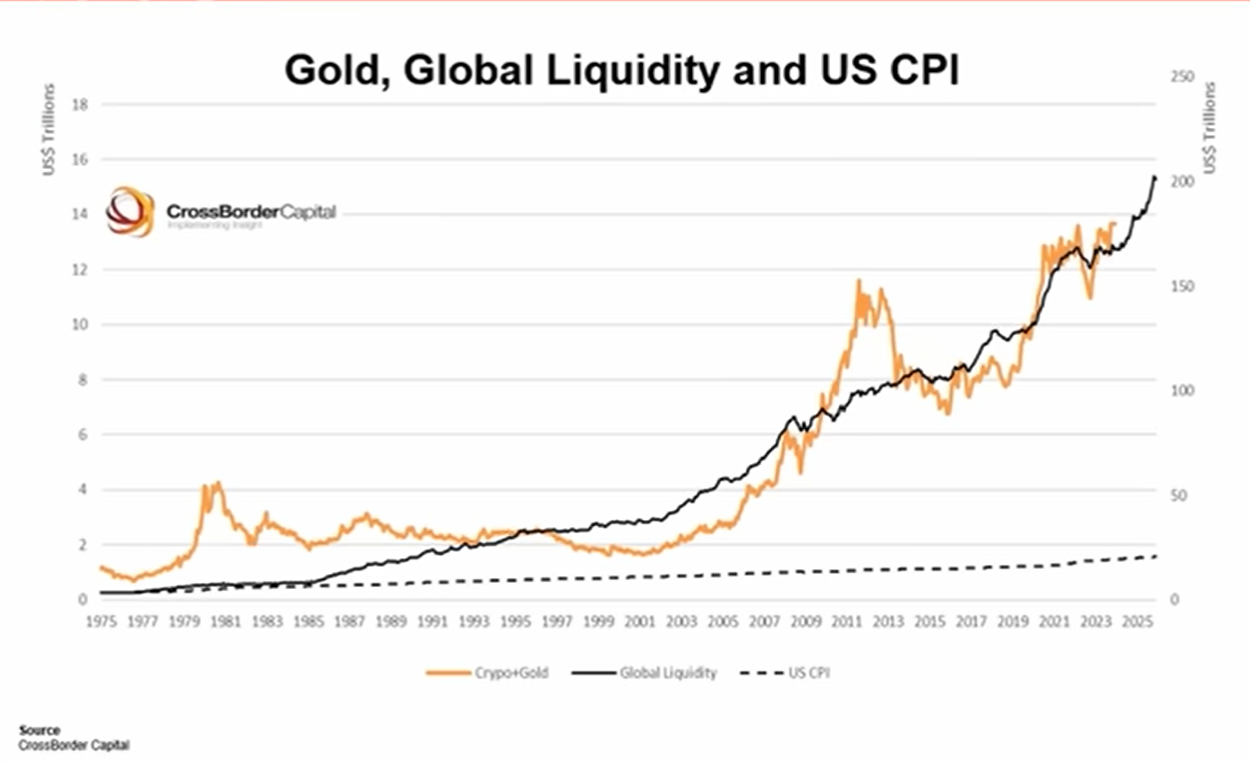
Liquidity drives gold higher. It's a brilliant monetary inflation hedge. Bullish on Bitcoin and gold. Calls Bitcoin "exponential gold".
1:12:00 Cyclically, thinks gold and Bitcoin is getitng a bid now. More monetary inflation but that doesn't necessarily mean "high street price inflation" because costs are going down. For example, China can devalue RMB significantly, oil prices can collapse, all of that can decrease consumer prices. However, he thinks gold and Bitcoin are good protections against monetary system inflation.
In this interview, he used the term "high street prices" a lot, which I think is a British slang term to describe perceived inflation based on what people are paying for products.