Adam Taggart / Lance Roberts Interview Notes 12/02/23
12/02/2023
1:00 bonds and stocks added $11T this month, second biggest monthly gain in history.
Biggest was November 2020. Fed was doing $120B in Q3 at that time.
US bonds best month since 1985.
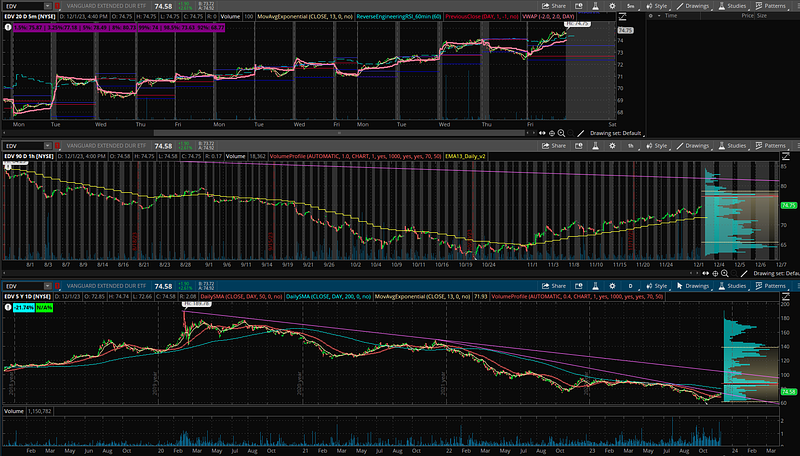
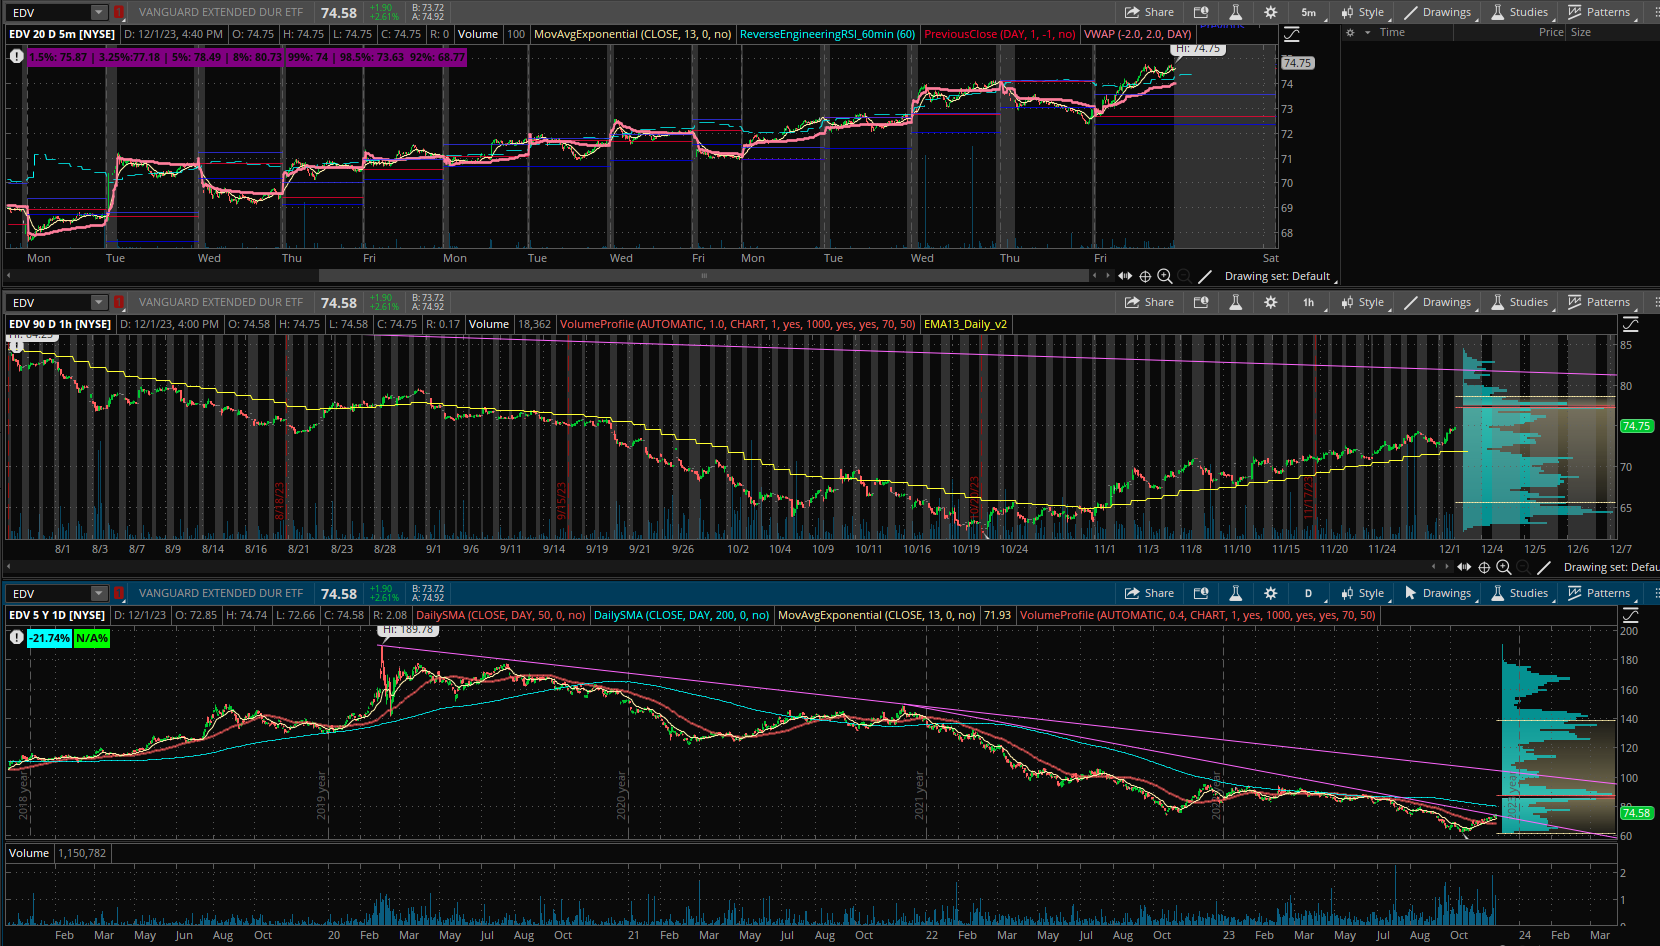
Lance in October sold some $TLT to swap for $EDV to get even longer duration exposure. Overweighted that position, so in November took a small piece of the position off.
We got below 4.3% on yields this week. Yields are overbought. Good time to take profits because there will be bounces in yield and better opportunities to get in.
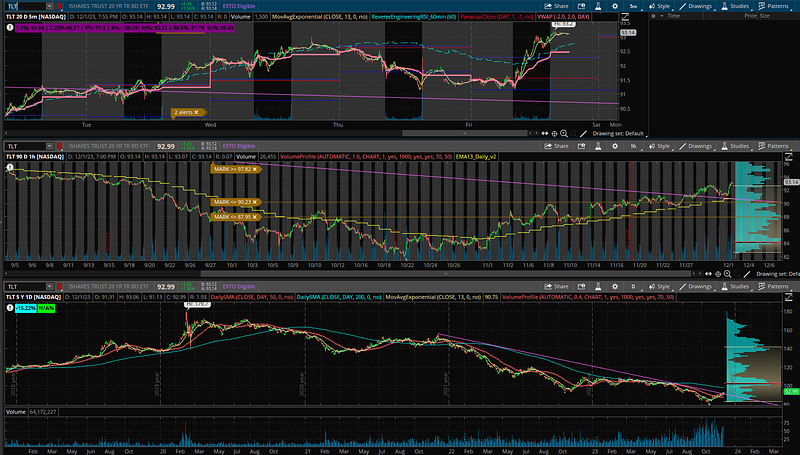
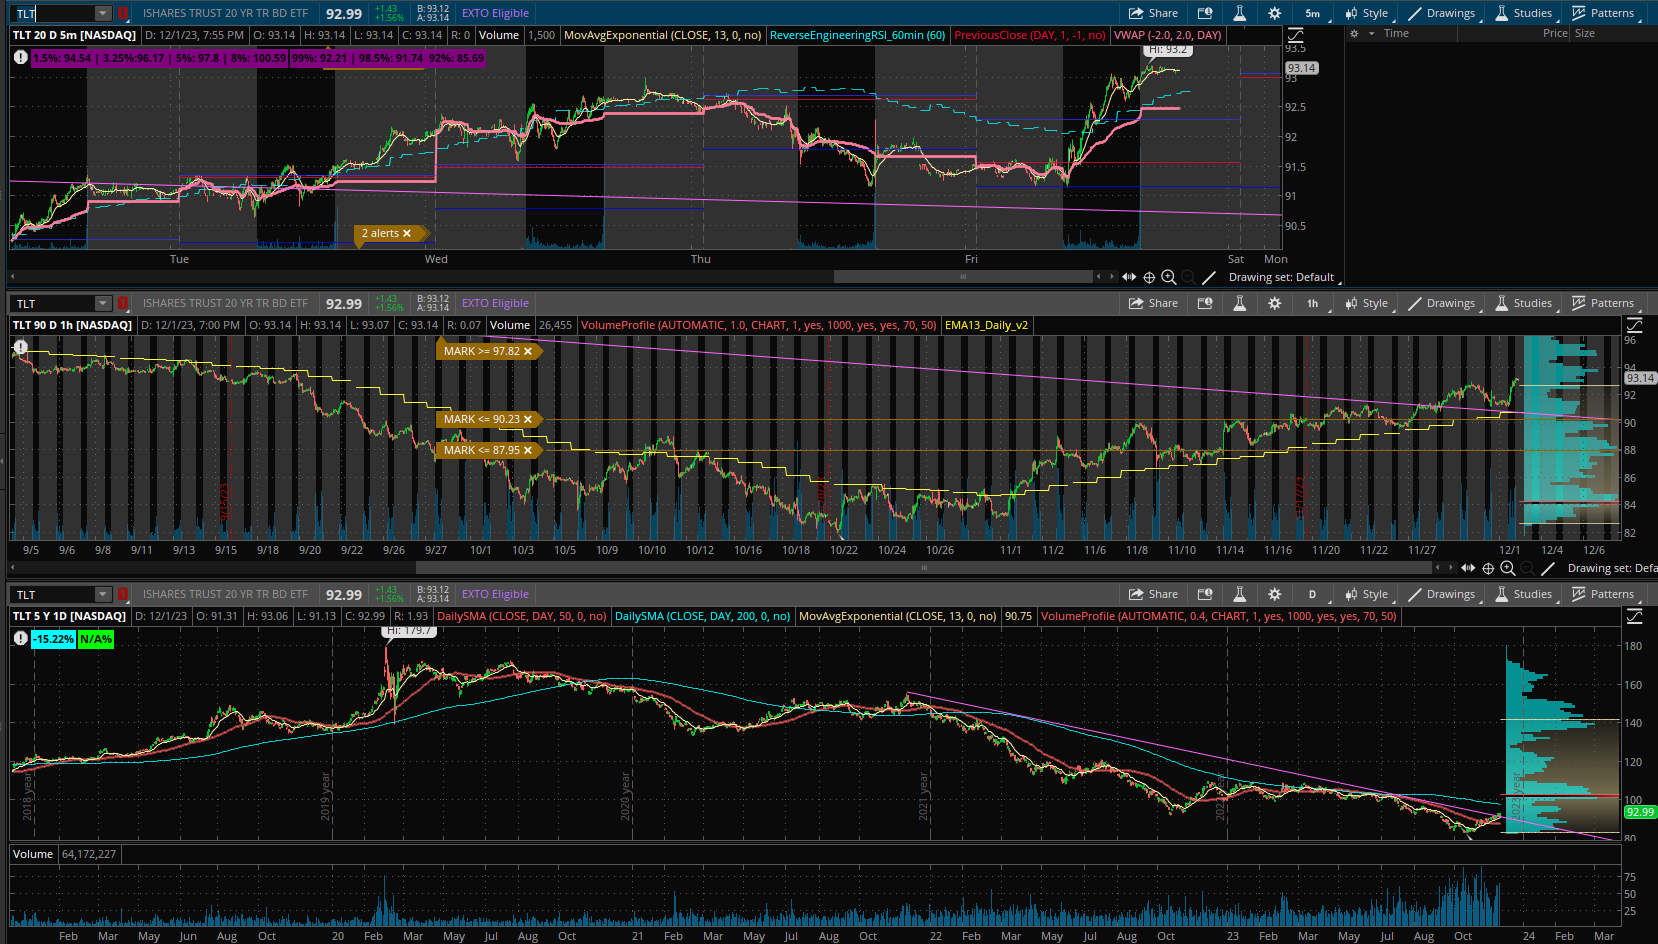
Midweek I posted a Tweet showing that the downtrend in $TLT looks ready to break the downtrend, noting the price and volume pattern. I think Lance is right that there will be a pullback at some point but my opinion is that from a technical analysis standpoint this looks like it's just getting started. I am not inclined to take profits until it gets up to the 200dma, like around the upper 90s or 100.
In my own account, I started a position right at the breakout point. Some traders like Lance buy all the way down. He probably got a lot of good adds to his position in the 80s. Other traders like me like to wait for a more technical indicator to signal the reversal of momentum. My opinion is that if you are buying on the way down for fundamental reasons alone, it can be difficult to time your entry, and you might have much downside left to ride. However, the more technical approach works best for small individual accounts because if you're managing millions of dollars, your trades affect the market liquidity, making it more difficult to get in and out quickly.
4:00 Liquidity & inflationary pressure
Fed has a meeting coming up December 13. October stocks were down and yields spiked. Problem with the reversal of that trend is that it loosens monetary conditions. Consumer confidence increases, more spending, more inflation.
Markets are getting too far ahead of themselves in relation to what the Fed may do.
6:40 "The Fed isn't actually going to hike again, but..." [they will threaten more rate hikes to influence behavior of market participants]
The Fed wants higher short term interest rates to curb consumer sentiment and spending to keep inflation under control. Market not cooperating. Starting to see a flow back into the market, which is probably a concern for the Fed.
AT: Market doesn't seem to believe the "higher for longer" narrative stated by the Fed. Market has been consistently wrong on the Fed's pivot timing, but doesn't seem to care. (i.e. it keeps going up)
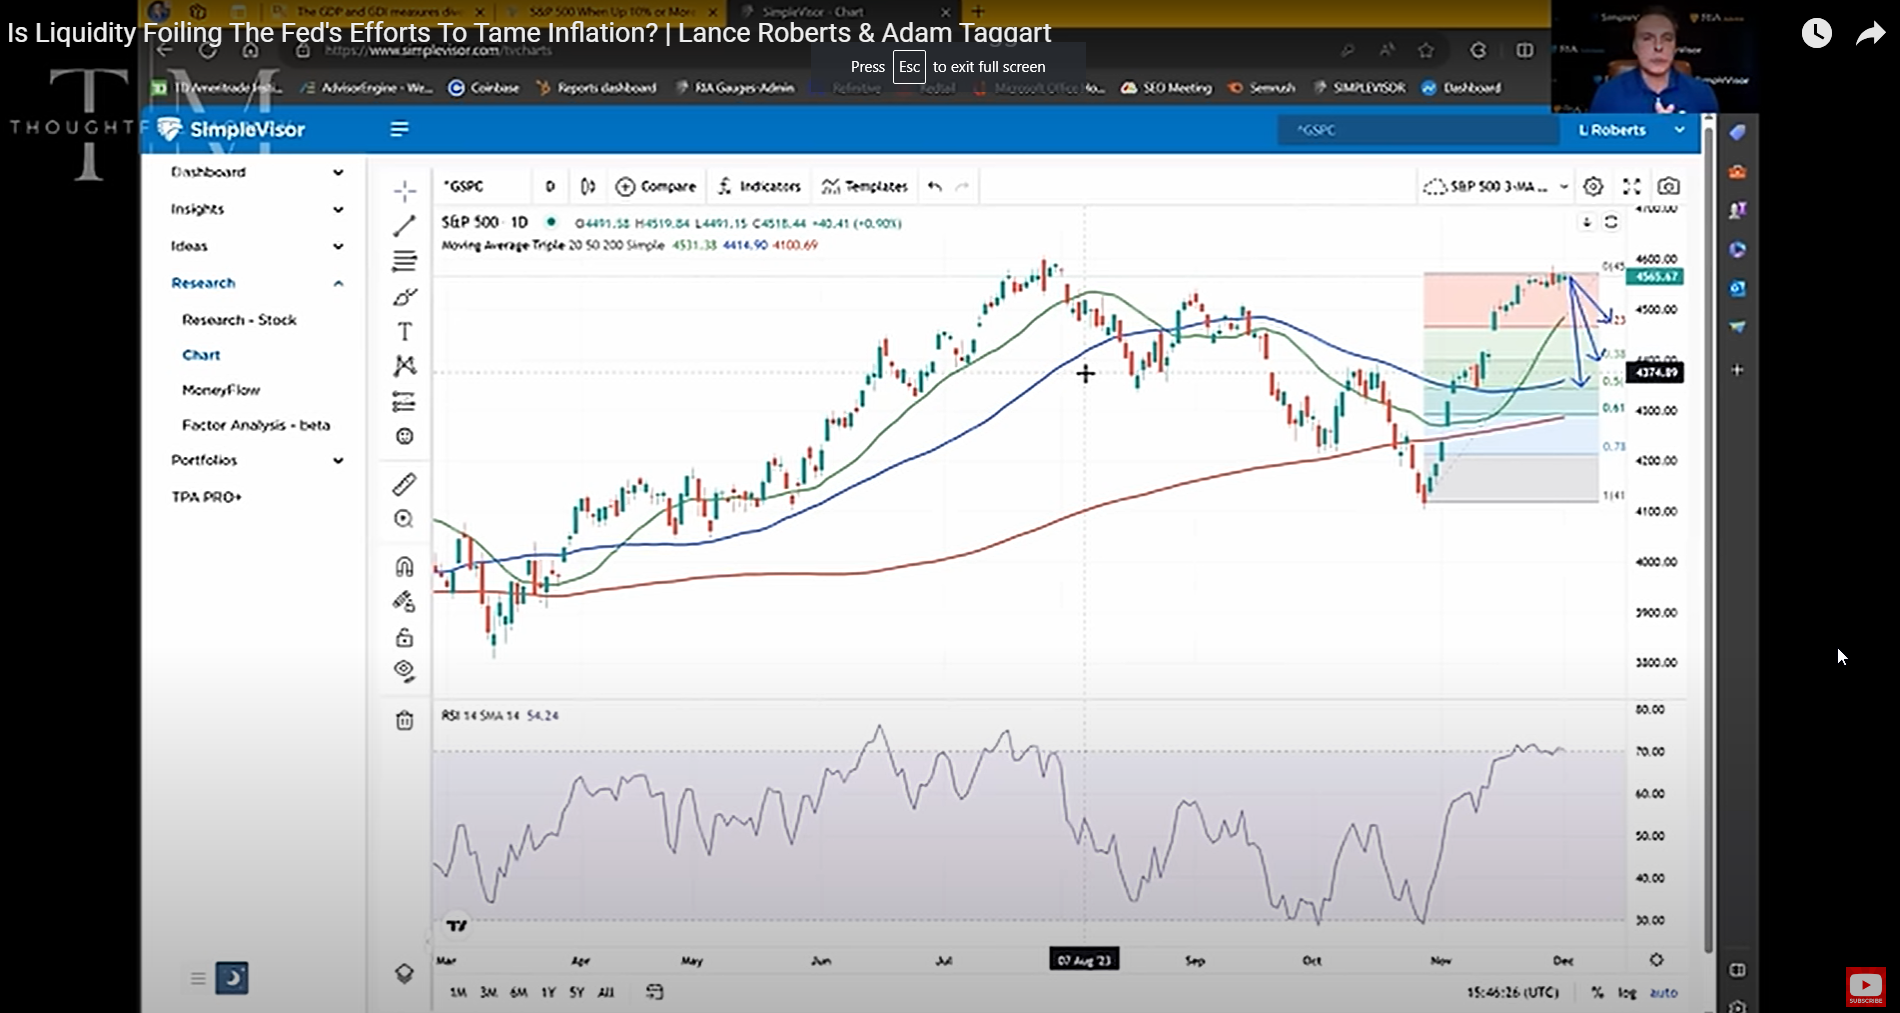
10:00 Possible market correction from here Note the blue arrows on the chart. We had a big runup and are overbought. Other possibility is that the market goes sideways for 3 weeks to work off overbought condition.
Lance: good time for tax loss harvesting, also taking profits to be offset from tax losses.
4325 area gaps - chance of fill? Would need some type of catalyst to make that occur. Bullish sentiment has to break.
Fed could shock market with a rate hike on the 13th.
20:00 A lot of the discussion from here was about coming up with an individual financial plan and risk management. It wasn't really appealing to my interests as I already know my financial strategy and I watch these mainly to get macro insights.
1:03:00 Liquidity - 6 month average for leading economic indicators beginning to tick up.
Simon White (Bloomberg): Liquidity buoyant over the last month. Principally due to $200B rise in central bank reserves. Money market funds funding the fiscal deficit through T-bills, and government withdrawing from the Treasury account at the Federal Reserve. Powers liqudity which leads to rally in stocks and bonds. But, impulse from reserves starting to fade. m/m fade of Federal Reserves is falling, which means absence of tailwind for stocks. A drop in the ISM would increase fears of a hard landing.
ISM change was actually 0 month to month for November. Economic data is starting to improve. We are seeing an improvement in the y/y rate of change, such as inflation coming down because of the y/y comparison. (i.e. disinflation, rate of inflation slows)
We've been in a recessionary downturn cycle for 18 months now. Inverted yield curve, ISM manufacturing, etc. The longer it goes on the likelihood of an actual recession gets contracted a bit.
Liquuidity has been flat for 18 months. Upticked just recently. We didn't have big bear market because we didn't get the expected drain of liquidity.
Lance: General 2024 outlook for the markets "I don't know"
Early 2022 to October 2022, the liquidity index is always falling. Everyone was super bearish. Then liquidity flatlined. and we got the start of the bull market.
Bank Term Funding Program provided liquidity to the market.
Thinking that bull market will continue is a risky bet. Economic data could be sloppy. Could have slow economic growth.
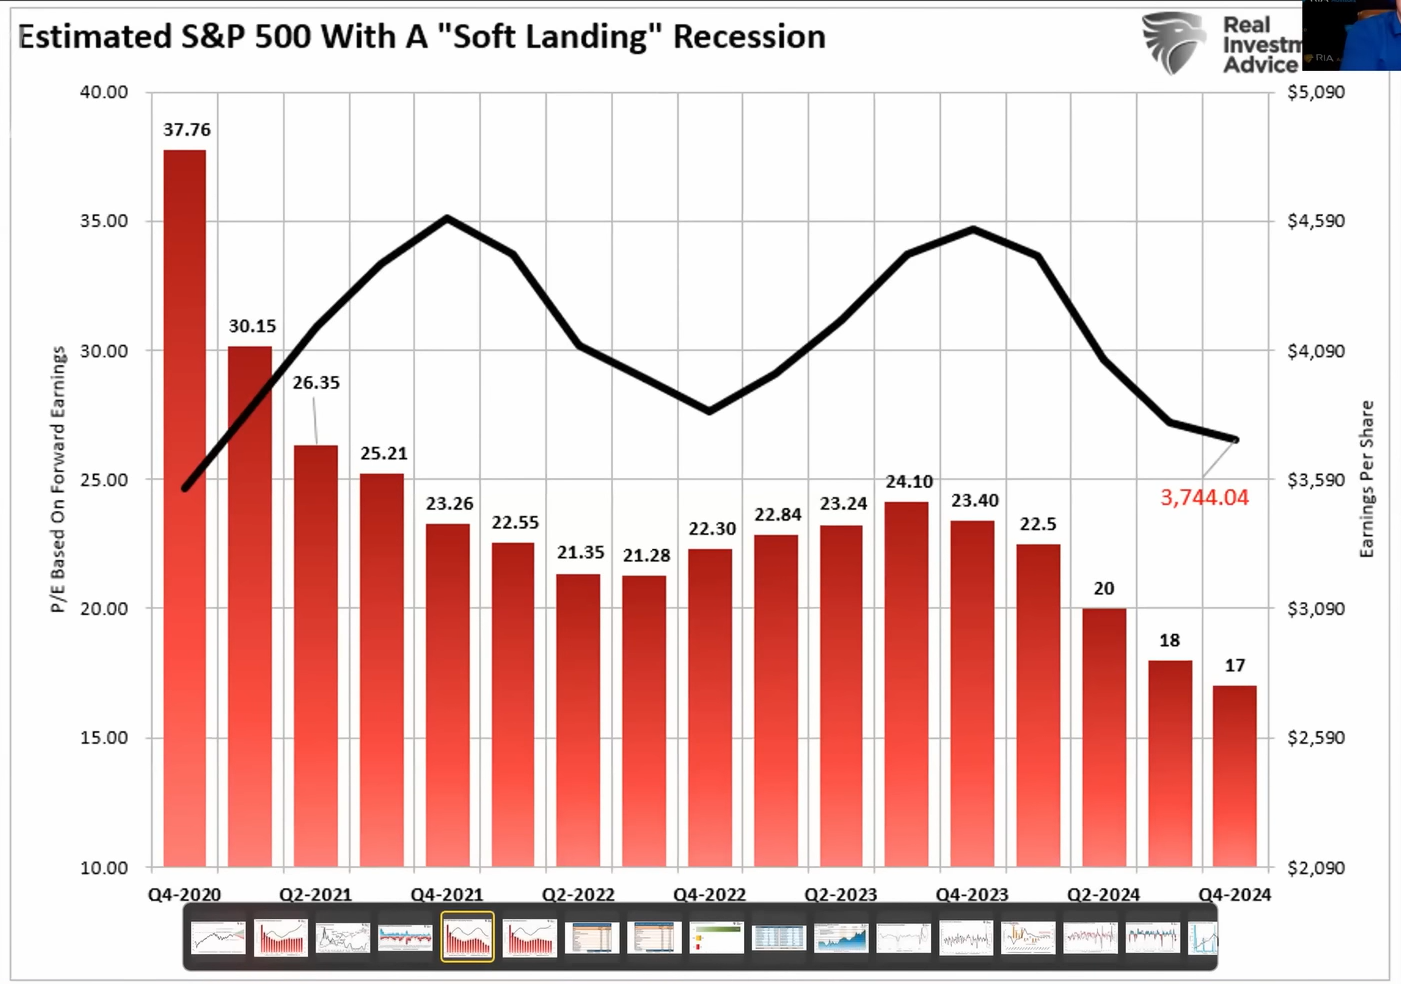
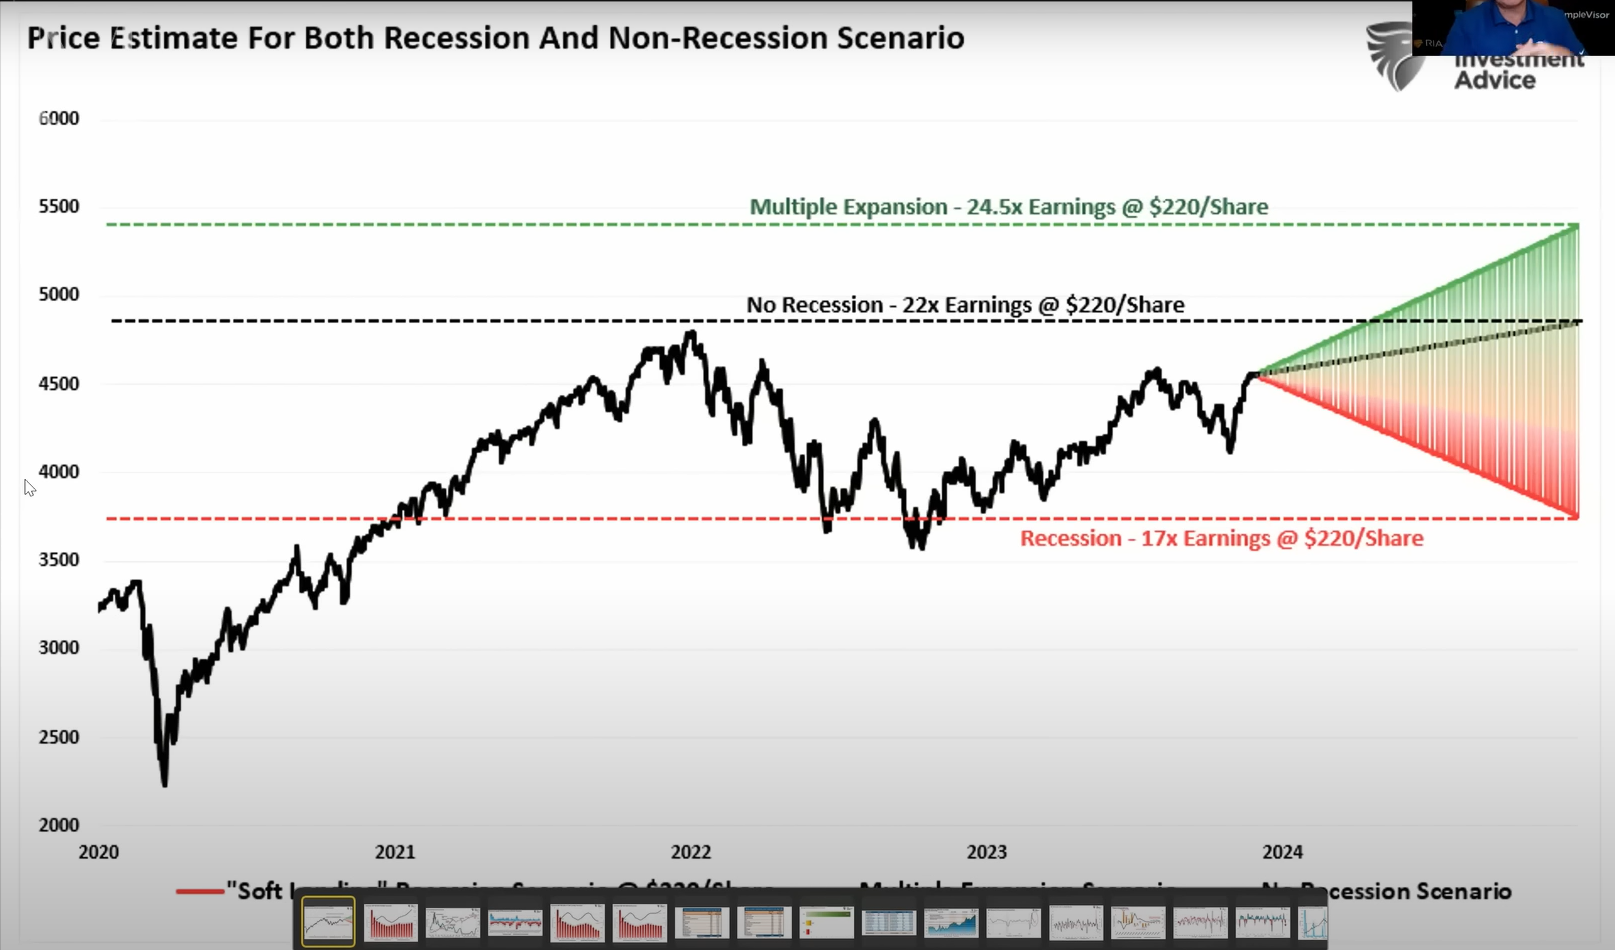
Soft landing ~17% decline, normal recession is a 33% decline.
2023, we had multiple expansion of forward PEs. 23X earnings to about 24.5X.
1:17:00 AT: Are we overthinking this? Or is this all about liquidity flow? Because liquidity hasn't been rising as much as S&P, could that indicate the market got ahead of itself?
Lance: gets lots of emails about Fed liquidity causing inflation. Fed does not print money, the Treasury does. Fed just does asset swaps. They buy bonds. That doesn't create money, it circulates money.
During 2009-2020, we never had inflation. Fed was fighting to keep inflation at 2%. We could have been in a recession if rates went up.
When the Fed does QE, that's not inflationary, that's an asset swap.
Fed's tools are QE and 0% interest rates. They make money available to the banks, not individuals.
We have inflation at 9% because we sent checks to households from the Treasury. Individuals had money to spend. There was demand and no supply, that causes inflation.
Greenspud: I don't know about this. He says nothing about supply side inflation. What about inflation caused by the material inputs of goods rising not because of people spending, but because the supply chains from China were messed up from all the geopolitics? Lance talks as if the United States is a closed loop but prices are affected by global conditions.
1:21:00 Epidemic of anxiety and depression
Lance: it's social media
1:22:00 Bonds / $TLT / Trades
What 10 year Treasury yield would be an exit? Lance's outlook on bonds has not changed because its an 18-36 month outlook. If you bought any recently as a trade, sell. Target is ~1-1.5%.
As the debt drags you to 2%, that drags inflation to 2%. Yields align with economic growth and inflation. GDP right now is 5.2% for Q3. Probably gonna be ~3-3.5% for Q4. Inflation ~3%. As economy goes down that pulls down the rates with it.
No trades this week.
1:25:00 BTFP hits record highs
That's not so bearish. (BTFP utilization)
High interest rates hit the value of the collateral the banks are holding (Treasuries), BTFP is just being used to make up for the difference.
AT: BTFP is a 1 year loan. We are now getting close to the 1-year anniversary. China banks being forced into national service of rescuing the developers in real estate. Any rumbilngs in the global banking system?
Lance: China will just bail out their problems. They are communist and can do that.
I agree with Lance. China is not as much of a systemic banking threat. IMHO they have a more closed loop economy than the US, so what they do is more easily contained and won't cause a global crisis.
Lance: We don't have the structure in the banks that we had in 2008, so it won't happen again. There is credit risk, but if anything happens central banks will immediately jump in to bail out.